
Python software for scopemeter UT81B
Few years ago I have bought a scope meter UNI-T UT81B. It is a good device for the prices, it can do a lot of measurements for you. Main limitation is a "single channel", and software provided by the Uni-Trend. Finally I decided to use the protocol specs I got from Uni-Trend and write a software for Linux because the provided software is for Windows only and it not good at all (even thou it is now version 3.0)
I found H. Mijail already wrote some code based only on a reverse engineering in python for windows using libubs-win32. As this was not portable for me I (re)wrote most of the code (using pyusb) and added other functionality based on the spec. You can now get waveforms and measurements in Linux too.
DMM UT81B software
Here is what I came with - moin colorized python code, note this is a work in progress, needs python 2.7 (tested on Fedora 20 with Python 2.7.5), latest code you can find down under download link:
Help and limitations
Should be self explainig - "-h" gives you help.
Generally there are two modes:
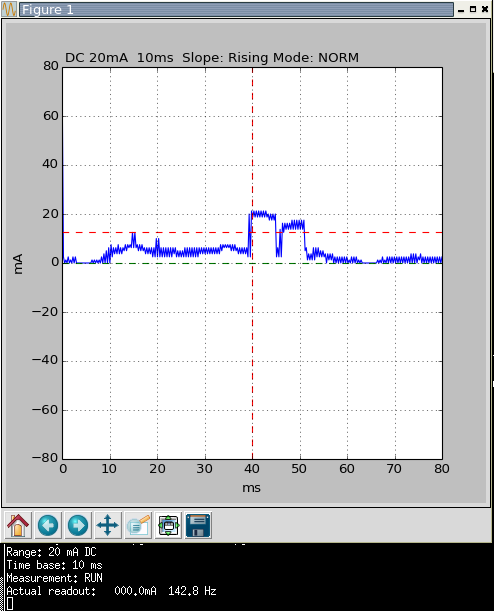
1. Single read out. It can either read a single measurement and displays it as text, or if scopemeter is set to waveform view it tries to obtain the waveform. If you want to be sure, you get the waveform back, you have to set the HOLD button on the meter. It also displays immediate waveform in "AUTO" trigger mode. The "NORM" mode this is a bit tricky. It heavily depends on when the trigger occurred and when code asks for the data. DMM only returns them once when they were captured and not later on without pressing the HOLD button. If in waveform mode it displays a zoomable picture with correct scales (contrary to what original software does) and with trigger point (red dashed lines) and base offset (green dashed line)
2. Continuous capture. You have to understand the limitation of this scopemeter and its communication capabilities. It either provides you only a value or a value with a waveform. It uses a kind of serial communication over USB. You have to ask the meter for a data in the right moment if you want a waveform when they are continuously triggered. This works well if your trigger is initiated often, if there is a long delay between triggers, it is hard to ask the meter for the data in the right moment. For that reason the continuous capture has an option of "CONT_CAP" timeout and you have to tune it for your triggers. For measurements read out, this is a delay between measurements, for waveform read out this is how long the code will wait for a capture data from the meter after it asks for them. The output is either to STDOUT or file. File may look like this then:
2014-10-15 09:27:06 INFO: Range: 20mA DC   Timebase: 10ms  Measurement: RUN  Readout:   000.3mA    ----
2014-10-15 09:27:06 INFO: Measured data [61.25, 2.5, 0.0, 2.5, 0.0, 2.5, 0.0, 2.5, 1.25, 2.5, 1.25, 2.5,
 1.25, 2.5, 1.25, 2.5, 0.0, 2.5, 0.0, 2.5, 0.0, 2.5, ...
You can later process data e.g. in office calc.. whatever.
Download
Project is on Pagure git now: dmm_ut81b